
The dashboard
What it does
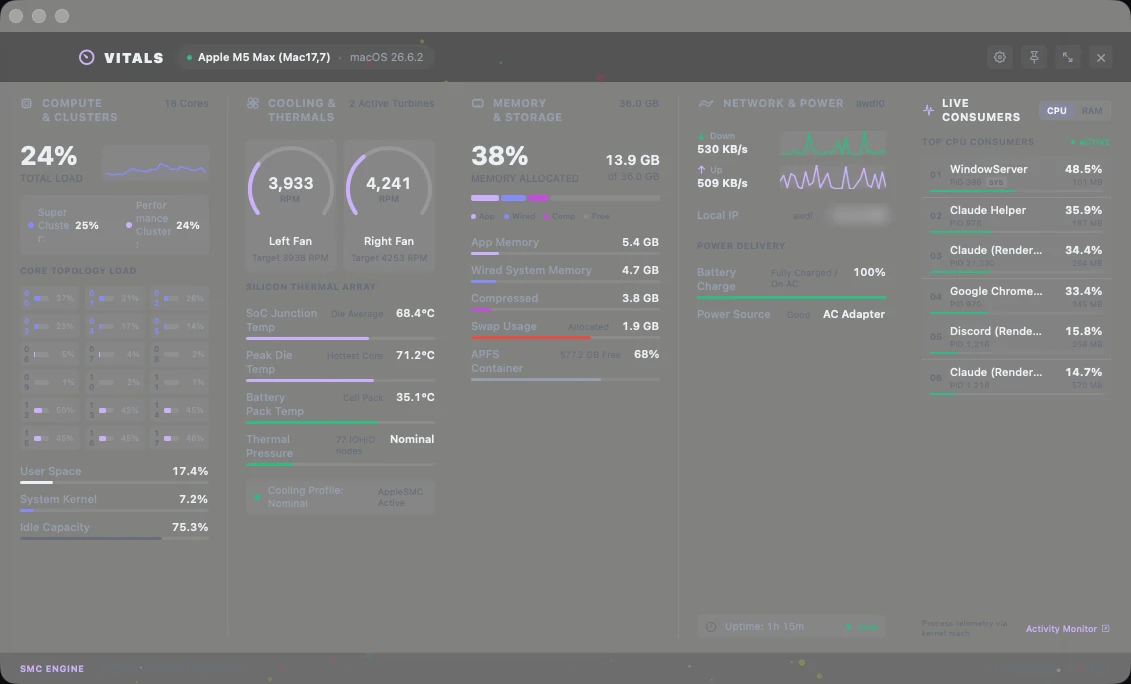
Vitals is a broadsheet, not a gauge cluster. Five columns, each a department: compute (total load, the efficiency and performance clusters split out, and every core in a topology grid), cooling (each fan's current RPM against the RPM the controller is asking for, then die, peak and battery-pack temperatures), memory and storage, network and power, and live consumers — the processes actually spending the machine right now, sorted by CPU or by RAM.
The numbers come from the hardware. An IOKit connection to the SMC reads the fan and thermal keys directly; the cluster load, memory pressure, disk, network and power figures come from the kernel's own counters. Nothing is inferred from a benchmark, and nothing is sent anywhere: there is no account, no telemetry upload, no network call the app makes on its own behalf.
How it's built
- The app
- Swift and SwiftUI with an AppKit shell, built as a plain macOS bundle. No framework beyond what ships with the system.
- The readers
- One small reader per subject — SMC, CPU, memory, disk, network, power, thermal, process — each returning a plain value type. A single telemetry engine polls them and publishes one snapshot, so the interface never reads hardware on the main thread.
- Fan curves
- Profiles — Silent, Normal, Cool, Turbo, and custom curves — mapped over temperature. Reading the fans is free; driving them is a deliberate, separate act behind its own control.
- The menu bar
- A modular readout: choose which figures ride in the menu bar, in which order, with which delimiter. It is the part that gets used most, so it is the part with the most settings.
- Colour
- Muted ground, one pastel per department, and the accent reserved for state. A dashboard that shouts at you is one you stop reading.
Where it stands
Running on one Mac, all day, mostly as a menu-bar readout with the full broadsheet a click away. It was written with a different model than the games were — the bench rotates — and it is the tool the others get judged against when a build starts heating the room.
Installer for Apple Silicon
Packaged for friends with an integrated 1-click installer helper that handles macOS download quarantine automatically.
Download Vitals-Installer.dmg · 2.0 MB
Quick Install for Friends: Open the DMG and double-click Install Vitals.command to automatically copy Vitals to /Applications and clear macOS download quarantine. Alternatively, drag to Applications, and if prompted by Gatekeeper on first launch, click Open Anyway in System Settings → Privacy & Security.